The Interweave

Human society is driven by the interweave of our separate identities.

It is our capacity to build and work within the warp and weft of that interchange that creates relationships, and it is our capacity to make our distinctly human relationships that makes us unique in the known universe.

These relationships have multiple facets driven by the unique qualities we each carry.  These relationships allow us to respect and support our mutual independence and our common co-dependence in the ebb and flow of each day, or neglect to respect.

This is the beating heart of the social dance we begin learning before birth and is the functional core that enables and drives our exceptional capacity to learn, to co-exist in an emotional universe, to navigate the range of possibilities our senses present.  It is the impetus for our capacity to think and act creatively, and for billions of us to co-exist on a single planet.

At its worst, it has us crushing each other when conflicting expectations and perceived needs leave us unable to find a cooperative or constructive path.  At its best it finds us in loving, constructive cooperation.

Whether we perceive a world of our demonic enemies versus our friendly allies, or a world of individuals with a common fundamental core in billions of flavors is a perceptual, belief driven outcome of our learning experiences, our beliefs, our expectations and our social capacity.  Combined these make us individual, and our individuality makes us capable of being both lovers and haters, confidently secure and frightfully insecure, dreamers and problem solvers, visionaries and tinkerers, collaborators or opponents, potential friends or perceived enemies – in our classrooms, in our communities, in our politics, and on the global stage.

These are choices we make.  Our choices leave a trail, evidence of our outcomes, our intents and the values embedded in our accomplishments.

Complexity in schools in 3D

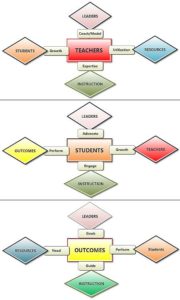
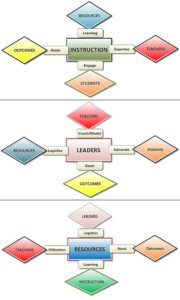
OverviewMany of the connections among the traditions in our schools have obvious links – teachers/resources/instruction, or students/ instruction/teachers/outcomes – while others are more complex.  This complexity of schooling – school leader as advocate for the students, or the range of items that might be considered as resources beyond instructional materials such as meals and transportation and the focus of our efforts to drive improvements is regularly captured in the variables between various frameworks, research studies, beliefs and practices.

Maybe it’s the air of summer, or the need to escape political discussions, or that conversation with a nephew about creating 3D imagery, that set this idea floating through one night which lead to messing around with ways to represent the notion, and consider how it might have value in the complex and often messy world of changing the outcomes we are getting in too many of our schools.

Each of the si1x3.1 panV1x3.2 panVx core elements has crosslinks to the other core elements and it is the intersection of these crosslinks and the complexity of how those links drive each other that is the heart of this visual.  One challenge is that none of these arrangements are fixed or all inclusive e.g. the “students” map does not contain resources, yet students are the primary beneficiaries of the resource allocations and students do utilize those resources be they textbooks, technology or lunch. – but there is generally an intermediary between them.

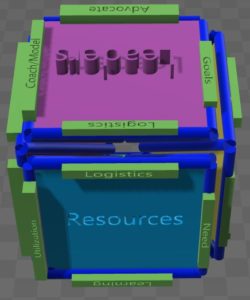
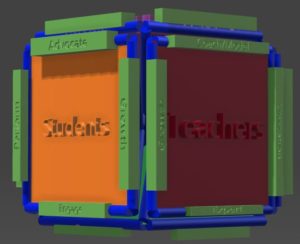
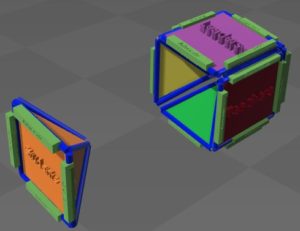
That is the nature of the complexity that I am hoping to explore in the 3D perspective in this model where  each core element is the face of a cube – like the six sides of a die. Disassembling the die gives each face a pyramid shape that joins all the other elements at the center – a confluence I am considering as the school culture resulting from the effects of all six elements working together.  If you can visualize that projection – each exterior edge aligns with one edge of four other facets, and inside the die, each corner and edge of the pyramid intersects with the corners and edges of two others – e.g students, teachers and instruction… (resources are linked to students through teachers “utilization” of resources, and “guidance” from those instructional resources).  This is the area I am working on next – how to describe and support consideration of what happens in and around those adjoining elements that create the school culture and what can we do intentionally to make it better.

Instruction Outcomes Resources Leadership Students Teachers

In the 3D model I have added a label at the point of intersection of the faces on the dice as an effort to offer a broadly descriptive starting point for considering the relationship between those facets- though like all such labels they are not intended to limit the scope of the relationship – just provide a starting point for consideration.

My thought is to turn this into a 3D space that has both a fly through to visit the concept intersections, and a walk through experience with attached guiding questions, along with follow-up sharing of the ideas and complexities that emerge as a point for further discussion.  (The screenshots above are from my first effort to remember how to build 3D models – its been a few years – but this is one of many free tools out there).


Improving education stats

Linda found this one: Arun Ramanathan of Pivot Learning Partners on statistics in education and statistics in baseball. https://edsource.org/2016/baseball-can-teach-education-a-lesson/566467

Stats OPS wikipedia
image source: https://en.wikipedia.org/wiki/On-base_plus_slugging

“So, why is education so old school?”
…and not just the data…
• We’re talking about public money so accountability is a must, but do we have to spend fiscal resources on the same things, in the same ways, with the persistent inconsistent results (as measured by our oversimplified indicators)?
• Is teaching more complex than playing ball? As you said, what measures might matter if we wanted to instill a more challenging level of play into the learning field by being better informed about how well we are playing the game?
• How does this work when the students, parents, advocates and data savvy teachers have a deeper and better grasp of the scope and implications of the data than the educational leaders?
• And then there is that old assumption that just because every game starts out with a nine inning expectation (and a television time slot with fixed commercial breaks) that the game will end on time, that the outcomes can be simplified into a win or a loss, and the fans will have had an adequately good enough time when the talking heads have filled out all the available air time…
We have to talk about systems as variable as the weather but most of our data only tells us about the conditions at one point some time in the past, that has few reliable reference points for what we might best do tomorrow.

Blending Learning or Blended Learning

The past half a dozen years have brought substantial discussion about blended learning – model maps, resources, strategies, personalized outcomes. I could try trashing “blended learning” by calling it what happens when all those learning resources are poured into the spout of the kitchen blender and the resulting “health food” is poured into a glass for consumption and the better good of the individual – but that is not what I mean – blended learning models are structures for supporting individual learning and providing structured opportunities for learning is perhaps the most critical role we have as educators. What I am most interested in right now is that other thing – Blending Learning…

I was talking with a school leader yesterday, (for context he was carrying a youngster for most of our conversation – estimating a kindergartner – sleeping on his shoulder, apparently in need of something warmer than a classroom chair that day) about how a decision made last fall has helped his students develop a visible improvement in numeracy skills (using a “blended learning” resource) but he is concerned that he has not seen similar progress in literacy skills, and his plans for addressing that – getting more literacy resources into the hands of students and teachers is a big concern. Then the conversation turned in another direction. If students are developing numeracy skills – and that is evident because they talk about it, show off their work, parents comment on it… aren’t those students practicing literacy skills as well? Does being able to “talk in numbers” just involve numeracy skills or does it also require literacy skills? And after a little brainstorming – maybe our students could extend their numeracy skills into literacy skills by thinking about, talking about and inventing scenarios where JiJi’s problem solving approach goes beyond numbers and patterns – a series of one act plays or skits about “What would JiJi do?” when faced with a real life challenge – taking the character students had taken to miming on the playground and creating new scenarios, creating and telling new stories – turning a learning that resulted from numeracy into building literacy.

image001This notion of blending learning across traditional boundaries is what we think of as “blended learning” – it is not a classroom design or technology systems challenge, (yeah there’s that too, but…) it is an instructional mindset based on finding opportunity in the vast maze of crossovers between our traditional content boundaries, talking about math, writing about science, illustrating the shifts of history… we have pretty much always blended learning this way – utilizing skills across boundaries, but how much farther can we go? These things are at the heart of Project Based Learning, Inquiry Based Instruction, field trips – can we make better use of “Blending Learning” by being more conscious of how and where that blending occurs and taking it farther – using our multiple literacies to build extended literacies? Recognizing that our students’ skills in blending learning may be the only context that matters.

Geeky about Process

flowchart

I admit to this much – I like thinking about process, and I have evidence – stacks of diagrams, outlines, flowcharts and whiteboard scratchings mapping a broad range of abstract notions about learning and organizations, – middle of the night outlines index finger tapped into Evernote or whichever app is handy — in multiple generations of complex Excel spreadsheets compiling assumption options into long range summaries, — a cloud based project management tool I am working on to help schools cross over from cool idea to “assuming we want to make that real – what should we do besides talk about it and congratulate ourselves for being so innovative?”

Today, I don’t see classrooms very often, a year ago I visited every one, everyday in the school we were helping get underway and checked in daily with some or all of the board, the leaders, the business office, the community supporters. (See the previous post about my computer’s smiley…). When it is not driving me up the wall, I love this dynamic. When the adults are making me nuts, I rationalize back – I have been at this a lot of decades, in a lot of situations, maneuvered through, over, under, around multiple barriers and other sticky, sometimes stinky situations. It all comes back to a single notion that has multiple identities – all related to the minds of children, adolescents and near adults. Sometimes it takes the shape of tending abundantly growing mind gardens, other times it’s a rushing stream as in Csikszentmihalyi’s flow, sometimes a replay of a student performance that has been stored enough to play back a sequence and the attached response, always its about the work of getting there – “what does it take to generate and support that level of mental engagement?”

So I work on these process maps, trying to find ways of getting there. Do we need a GPS? Do we need a guru? Do we need a special opportunity or invitation? Or maybe just an inspiring cup of coffee…

Feedback and Data — The metronome of a blended classroom

Read this subhead in an article this morning and knew I had to have it:

Feedback and Data  – The metronome of a blended classroom. 

Music2This a subheading in an EdSurge article about the strategy an Aspire school used in implementing a rotational blended learning model. A quote from the article: In Aspire’s blended classrooms, teachers receive both formative and summative data from many sources; using that data strategically is key to providing targeted instruction.”

Article is here.

I’ll take metaphors wherever I can find them and this one resonates… of all the noise that comes with a classroom, a rhythmic beat, embedded in the ambiance, that flows from pace and activity of growing minds, not merely imagined, visible, not just measurements, viable evidence, illuminating…


My computer earned a Smiley

Last year I replaced a rapidly fading laptop. The old one had been durable, traveling to schools across the country for six or seven years. The new one, a wide screen, touchscreen, convertible, was getting its break-in during the start-up of a new school we were supporting. Getting late into the evening, I was sitting on a donated sofa in the reception area, working on budget notes, when a young man in the all-day kindergarten class crawled onto my lap. He was the reason five of us were still there working late, waiting, not for the first time, for a family member to arrive.

I had tried out a game designed for my widescreen touchscreen the other day, popping bubbles on the touchscreen, and showed it to my newest friend. He played a few rounds before getting antsy, not quite catching on to the idea of strategic bubble popping for added points. Before heading back to the Legos on the floor, he stopped, thanked me and removed a smiley face sticker from the back of his hand and put it on my computer. A year later it is still there, seemingly not much wear and tear at all, reminding me of why we do this, and that perhaps the most important measure of how well we are doing is in their eyes.